Graph / Chart Description
Graph/chart description. Outline of the bar chart description. StepIntroduction. Step Example. Step verall trend. Step Example. Step Body. Step Example. Step Conclusion. Step Example. Outline of the pie chart description. StepIntroduction. Step Example. Step verall trend. Step Example. Step Body. Step Example. Step Conclusion. Step Example.
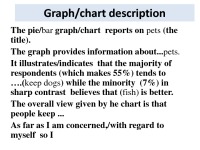
The pie/bar graph/chart reports on pets (the title). The graph provides information about...pets. It illustrates/indicates that the majority of respondents (which makes 55%) tends to ....(keep dogs) while the minority (7%) in sharp contrast believes that (fish) is better. The overall view given by he chart is that people keep ... As far as I am concerned,/with regard to myself so I.
Slightly/ gradually/; significantly/ sharply rise/increase; fall//decrease A slight /gradual rise/increase in... Stay the same Change very little Twice as many ...as X times more/fewer...than... More /less than ( a quarter, half, a third .. ) of... More than half the population used ... in 2005 ...whereas the number of (mob.ph-s) nearly doubled.... The vast majority / a small minority of...
Step1. Introduce the bar chart. Step 2. Describe the overall tendency without any numbers. Step 3. Group information: describe the longest and the shortest bars, use numbers. Step 4. Conclude by summarizing the main trends in the chart.
Introduce the chart and present full information about the chart: date, location and subject . Use present tenses. Paraphrase the chart title.
Describe the overall tendency. Use past tense for information that refers to the past. Do not include numerical information (percentage, increase, decrease) in this step.
- Mathematics Presentations
- MS PowerPoint 106 KB
- 2018 m.
- English
- 21 page (832 words)
- Gymnasium
- Deimantė


")


