Econometrics Paper
Content. Introduction. Significant variables. Outliers. Backward elimination. Model equation. Evaluation of the adequacy of the final model. Forecast. Mean absolute percentage error (MAPEEvaluated errors of estimated model. Conclusion. References. List of tables.
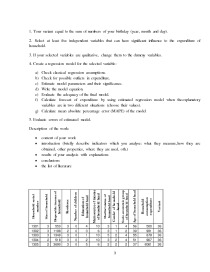
1. Your variant equal to the sum of numbers of your birthday (year, month and day).
2. Select at least five independent variables that can have significant influence to the expenditure of household.
3. If your selected variables are qualitative, change them to the dummy variables.
Calculate forecast of expenditure by using estimated regression model when theexplanatory variables are in two different situations (choose their values).
introduction (briefly describe indicators which you analyse: what they measure,how they are obtained, other properties, where they are used, oth.)
There are different indicators which have in impact to dependent variable, for example: age, household incomes, gender, marital status and other. To evaluate the relationship between different variables it is convenient to use a regression model. Doing this regression analysis, I will determine which factors are significant. First of all, I will change qualitative and quantitative variables table into dummy variables. For qualitative variables I will use correlation method and if variable value is higher than 0.5, than it will be significant. For quantitative variables I will do regression and if its p-value is less than 0.05 than it is significant. My main purpose is to to evaluate the household consumption by creating an estimate model.
I need to choose at least five independent variables that can have significant influence to the expenditure of household. Some of my variables are quantitative which I need to change them into dummy variables. Firstly I choose all quantitative variables and make a correlation analysis.
Quantitative variable is significant if its value is more than 0.5. In my case “Number of children” is the only correlative variable which has significant meaning. I need to find 4 more variables and now I will do dummy variables for quantitative variables. I will use a regression analysis for each qualitative variable which has some descriptions and which’s p-value is smaller than 0.05 will be most significant to my model.
Table 3 Main source of income of household head: pension benefits
I choose 4 variables, which has the smallest p-value. I have to choose those variable whish p-value is less than 0.05.
Main source of income of household head: pension benefits, p-value = 0,038034
Marital status gruop of household head: married, p-value = 0,00536
Socio-economic group of household head: retired people, p-value = 0,038034
Here I see that might be 3 outliers (highest and the lowest points) and I need to check it and check multicollinearity. After checking I found two outliers which p-value is less than 0,05 and there is multicollinearity problem.
- Economy & Finance Papers
- Microsoft Word 170 KB
- 2019 m.
- English
- 23 pages (4656 words)
- University
- Inga


")


