How To Describe Bar Charts And Pie Charts

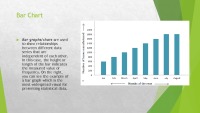
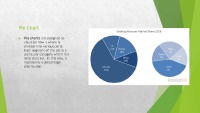
How to describe bar charts and pie charts. Bar Chart. Bar graphs/chars are. Pie Chart. Pie charts are designed to visualize how a whole is divided into various parts. How to begin a description. To catch your audience’s attention from the very beginning. How to describe diagrams and other visuals naming the parts. To describe diagrams or any other type of graphs as clearly as possible. How to describe a bar graph. Bar graphs transform the data into separate bars or columns. How to describe a bar graph. Example. How to describe a pie chart. The pie chart. How to describe a pie chart. Example. Here we have.
- Mathematics Presentations
- MS PowerPoint 1525 KB
- 2021 m.
- English
- 9 pages (449 words)
- School
- Ervinas

Retail, 39 pages

Health & Nutrition, 13 pages

Information technology, 3 pages

Religion & Spirituality, 25 pages

Management, 29 pages

Business & Entrepreneurship, 28 pages

Transport, 36 pages

Engineering, 7 pages

Beauty & Makeup, 19 pages

Languages, 25 pages

Marketing, 38 pages

How to describe bar charts and pie charts. (February 15, 2021). https://documents.exchange/how-to-describe-bar-charts-and-pie-charts/ Reviewed on 09:17, July 29 2026


