Slides On 2D And 3D Graphics


Graphics Part. A look into vector, 2-D and 3-D graphics, and more. Work by student Jūratė Stasiulytė. Content. Introduction Sources of Bitmapped Images. Introduction. During this presentation. Sources of Bitmapped Graphics. Paint Programs Digital Cameras Clip Art Screen Grabs. Vector-drawn Graphics. Definition. A vector is a line with a particular length. Comparing and converting. Definitions. Autotracing – drawn graphics produced from bitmapped images through the means of autotracing. -D Computer Graphics. Modelling. The most popular ways of creating models are to use Polygons. Polygon Modelling. Spline modelling. Definition. Spline modelling is curve-based and is similar to two-dimensional vector graphics. Metaball modelling. Metaball modelling creates objects as combinations of elements called blobs. Formula. Modelling. Definition Formula modelling. Surface Definition, Texturing. Scene composition, Rendering. Scene composition Rendering Pre-rendering. Conclusion.
Introduction; Sources of Bitmapped Images; Vector-Drawn Graphics; Comparing and converting; 3-D Computer Graphics: Modeling; Surface Definition; Scene Composition, Rendering; Conclusion.
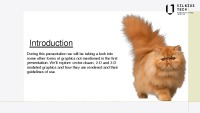
During this presentation we will be taking a look into some other forms of graphics not mentioned in the first presentation. We’ll explore vector-drawn, 2-D and 3-D modeled graphics and how they are rendered and their guidelines of use.
Paint Programs; Digital Cameras; Clip Art; Screen Grabs.
Definitions. Rasterizing – vector graphics converted to bitmapped images.
The most popular ways of creating models are to use: Polygons; Splines; Metaballs; Formulas;.
Metaball modelling creates objects as combinations of elements called blobs, similar to clay. These blobs are variously shaped and are either positive or negative.
- Technology Presentations
- MS PowerPoint 25900 KB
- 2021 m.
- English
- 15 pages (373 words)
- University
- Jūratė


