Quantitative Methods In Economics
Quantitative Methods in Economics.
Hypothesis: As time goes by and more rules that are new are adopted, the number of Formula One viewers decreases.
2012- Cars must be cleared from all crash tests before pre-season testing.
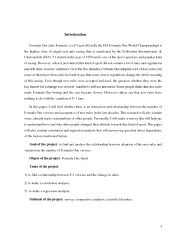
In this project, I will analyze how the number of f-1 viewers changed with adoption of new rules. I will not analyze all the rules that were adopted in the last decades. I will only analyze the most important rules, or the rules that were criticized the most.
For my data analysis I will use my own survey that I made and uploaded to different Formula One websites. My survey was mainly answered by formula one fans. However, in this project, I will also use the data, surveys and analysis that was made by other people.
My depend variable in this project is Formula One viewers.
According to the scientific papers, analysis and surveys made by other people, I chose 8 independent variables. Those independent variables are different Formula One rules. Those rules were chosen because they had the most influence on the viewers number.
X7 - limitation of resources and financing (limitation of engines, tyres, fuel, etc.)
As I mentioned above, the hypothesis of my research consist of adoption of new rules and change in formula one viewers. I suppose that formula one viewers number decrease because a lot of new rules were adopted. To do that I have to find the relationship between dependent variable (Formula One viewers) and independent variables ( adjustable front wings, safety rules, KERS, DRS, decreased horsepower, double diffuser, limitation of resources and financing, penalties for drivers and teams).. For my further analysis about how independent variables influence dependent variables, I have chosen to use the method of regression analysis.
ln(number of viewers) = β0 + β1*(KERS) + β2*(DRS) + β3*(adjustable front wing banned) + β4*(safety rules) + β5*(decreased horsepower) + β6 *(double diffuser banned) + β7*(limitations of resources and financing) + β8*(penalties for drivers and teams) + ε
In this project, I used my own survey that was made for better understanding of how people react to adoption of new rules. This survey will also help me to analyse how the number of formula one viewers changed. My survey consisted of different questions. Information about age, gender was also included. My further questions were:
Information about gender (if the answer is 0 is female gender, the answer 1 is male gender)
First question: Do you have a TV? ( if the answer is o, then it means that the person does not have a TV, if the answer is 1 it means that a person owns a TV)
Second question: How often do you watch Sport Channels ( if the answer is 0, then it means that a person never watches Sport Channels; if the answer is 1 it means that a person watches Sport Channels few times a week; if the answer is 2 it means that a person watches Sport Channels around 4 times or days a week; If the answer is 3 it means that a person watches Sport Channels all the time)
- Economy & Finance Term papers
- Microsoft Word 1039 KB
- 2017 m.
- English
- 19 pages (5490 words)
- University
- Laima


