Balance Sheet Samsung


Description. Consolidated statements of financial position. Consolidated statements of comprehensive income. Financial analysis of the company’s activity. Liquidity ratios. Activity ratios. Leverage ratios. Profitability ratios. General conclusion.
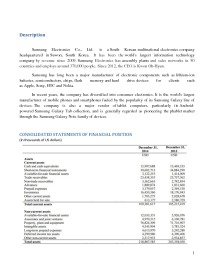
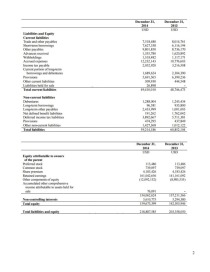
Liquidity ratios show that in 2014 the company’s liquidity was greater than in 2013;
Activity ratios represent the company’s greater efficiency of using its resources in 2013;
In 2013 the company was leveraged more than in 2014;
Considering profitability ratios, Samsung Electronics Co., Ltd. was more attractive to investors in 2013 compared to 2014.
- Economy & Finance Individual works
- Microsoft Word 319 KB
- 2017 m.
- English
- 7 pages (387 words)
- College
- Ugne
Balance sheet Samsung. (December 8, 2017). https://documents.exchange/balance-sheet-samsung/ Reviewed on 14:05, August 2 2025


