Apple's Balance Sheet
Apple’s balance sheet. Total asset. The total assets. Current + Non-current asset. It can be seen proportions of assets contained total asset. So this. The main data in this chart is long-term markable securities. Goodwill and intangible assets. Reasons why graph has changed For the September 2014 period. Liquidity ratio. Provides a measure. Debt to equity ratio. A high debt/equity ratio is often associated with high risk. Thank you for your attention.
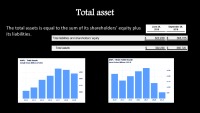
The total assets is equal to the sum of its shareholders’ equity plus its liabilities.
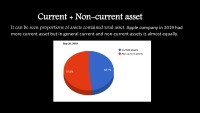
It can be seen proportions of assets contained total asset. Apple company in 2019 had more current asset but in general current and non-current assets is almost equally.
So, this is contained by cash and cash equivalents and short-term markable securities which takes the more than 60% of the chart.
The main data in this chart is long-term markable securities.
Reasons why graph has changed: For the September 2014 period, the company tacked on $2.
- Business & Entrepreneurship Presentations
- MS PowerPoint 584 KB
- 2020 m.
- English
- 9 pages (270 words)
- University
- Ugnė


